SupportCandy Reports 3.1.8
Wordpress Plugins SupportCandy 4.8 (2.2K reviews)
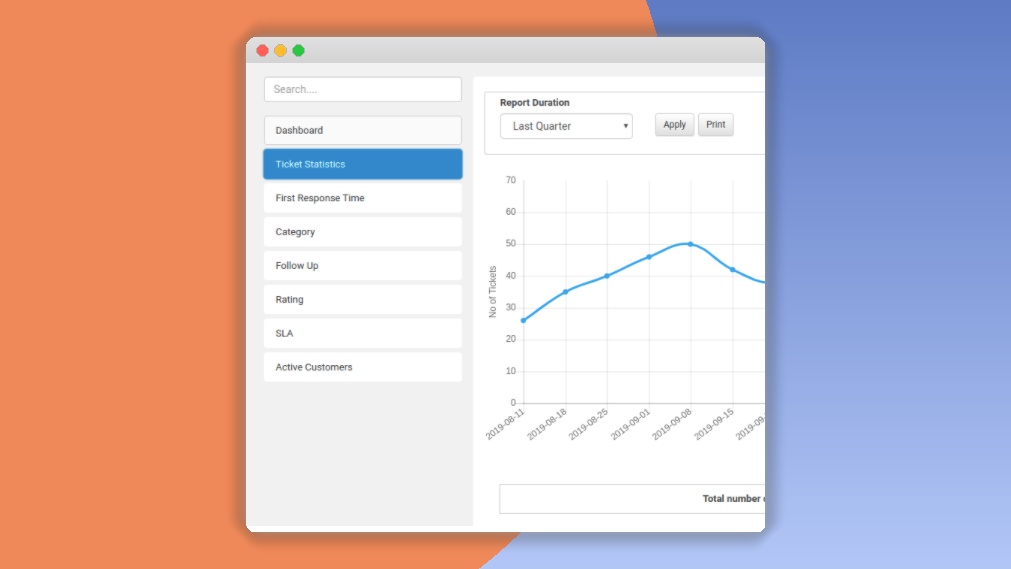
SupportCandy Reports is an add-on plugin for the SupportCandy help desk and ticket system in WordPress. It takes the data your support team generates every day and turns it into clear, readable reports. Instead of guessing how your team is doing, you can open a dashboard and see ticket volumes, response speeds, and satisfaction levels at a glance. The plugin connects directly to the SupportCandy ticketing database, so there is no manual data entry or export-import dance. Everything updates in real time. You can see which issues are piling up, how quickly each ticket gets a first reply, and whether customers are happy with the outcome. That kind of visibility is hard to get from a regular ticket list. For anyone running a support operation on WordPress, this means being able to answer questions like "are we falling behind this week?" or "which agent handles the most tickets?" with actual numbers, not impressions. It's built specifically for SupportCandy, so it fits right into the existing workflow.
Other products to consider

 Codecanyon


The main reporting areas cover the metrics that matter most in a help desk. The dashboard brings them together as charts and summary widgets, so you can spot patterns without digging through spreadsheets. Ticket analysis shows volume by status, category, and priority, helping you spot bottlenecks and seasonal spikes. Agent performance reports track individual work, resolution time, and satisfaction ratings, which makes it easier to identify coaching opportunities or distribute workload fairly. Response time metrics break down first response and overall resolution timing, so you can see if your team is meeting expectations. Customer satisfaction scores are collected through integrated CSAT surveys and appear in their own report, giving you a direct read on how customers feel about the service they received. There is also SLA tracking, which shows whether your team is meeting agreed response and resolution commitments, including early warnings when a deadline is at risk. That makes it a practical tool for weekly team reviews and planning.
You are not stuck with fixed report layouts. SupportCandy Reports lets you build custom reports by picking the exact data points you want, then applying filters for date ranges, agents, categories, and priorities. Filters can be combined, so you might narrow things down to high-priority tickets from a single category or one agent's active cases. That makes it possible to focus on a specific product, a single agent, or a particular week. Once a report is ready, you can export it as CSV or PDF, which is helpful for sharing with managers or for doing deeper analysis in spreadsheet software. Trend analysis uses historical data to show patterns over time, like whether ticket volume is growing for a certain issue or whether response times are trending downward. The interface is responsive, so reports are readable on a desktop, tablet, or phone, and the dashboard widgets can be arranged to show the numbers you check most often.
To use SupportCandy Reports, you need the free core SupportCandy plugin (version 3.0.0 or higher) installed and activated. The add-on works with WordPress 4.9 and newer, PHP 7.0 and newer, and standard modern browsers. Because it is an add-on, the reports appear inside the SupportCandy menu in your WordPress admin, so there is no second interface to learn. Everything you need is right in the same admin menu, which keeps the reporting workflow close to where you actually handle tickets. The reports draw from your existing SupportCandy data, so there is no extra setup or synchronization to manage. The data is pulled from the same tickets you work on every day, so the reports always reflect the current state of your support queue. For a support manager, this type of reporting turns daily ticket activity into evidence you can act on, whether that means adjusting staffing, improving response times, or just understanding what your customers are asking about.
- Last updated
- August 12, 2026
- Delivery
- Digital
- Availability
- In stock
- Version
- 1.5
- Category
- Wordpress Plugins
- Item type
- plugin
This page summarizes the available listing data for SupportCandy Reports in Wordpress Plugins. The item type is recorded as plugin, with further details shown below.
Usage rights depend on the license selected at checkout. Review the complete terms before using this item for client work, redistribution, SaaS, or more than one end product.